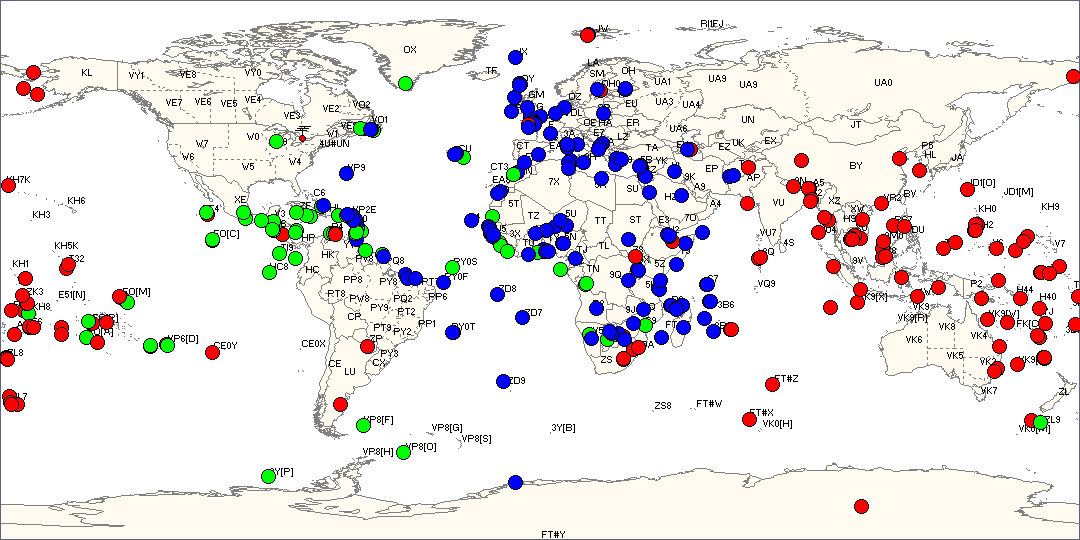
 Click to enlarge | Fig.1. The continent with the highest number of QSO.
AS is red, NA is green, EU is blue |
To find this out, I collected the QSO by Band statistics for 486 DXpeditions from ClubLog and OH2BU Mega DXpeditions spreadsheet, and plotted the data on the map. In Fig. 1 below, every DXPedition is represented with a circle, and the color of the circle corresponds to the continent that had the highest number of QSO with that DXpedition. I used red for Asia, green for North America, and blue for Europe.
|
Click to enlarge | Fig.1. The continent with the highest number of QSO.
AS is red, NA is green, EU is blue |
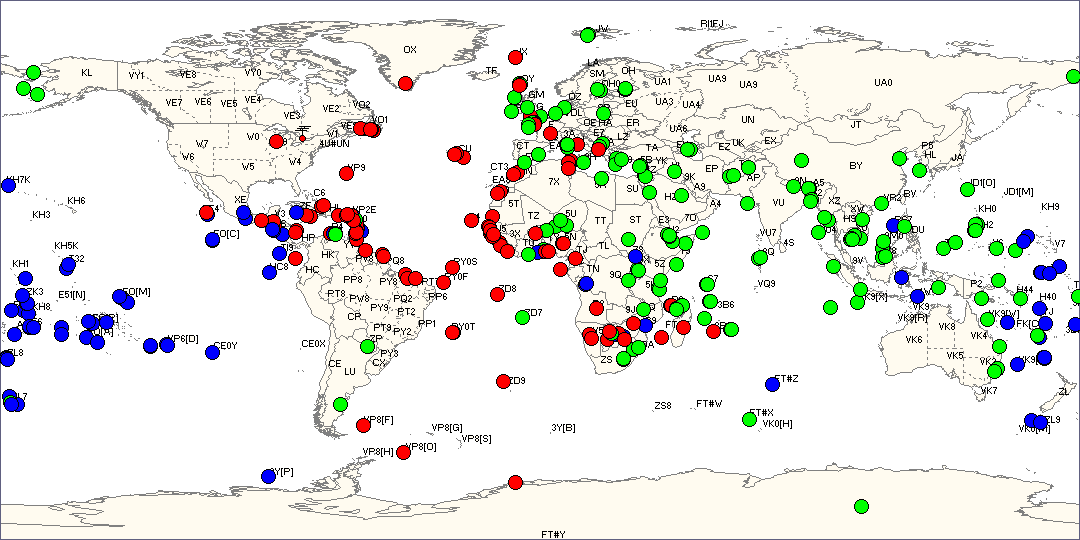
 Click to enlarge | Fig.2. The continent with the highest QSO per Ham |
The map on Fig.2 shows where our easy DX is. A similar map on Fig.3 shows the difficult DX as it plots the continent with the lowest number of QSO per Ham. The color codes are the same as on the previous maps.
 Click to enlarge | Fig.3. The continent with the lowest QSO per Ham |
For those who want to play with the data, here is a list of all DXpeditions used in the analysis, with their QSO counts: DxpedCounts.lst. You can open this file in Notepad, or view it in DX Atlas on the map using the File / Load / Island List menu command.
Please email your comments to
![]() .
.
73 Alex VE3NEA